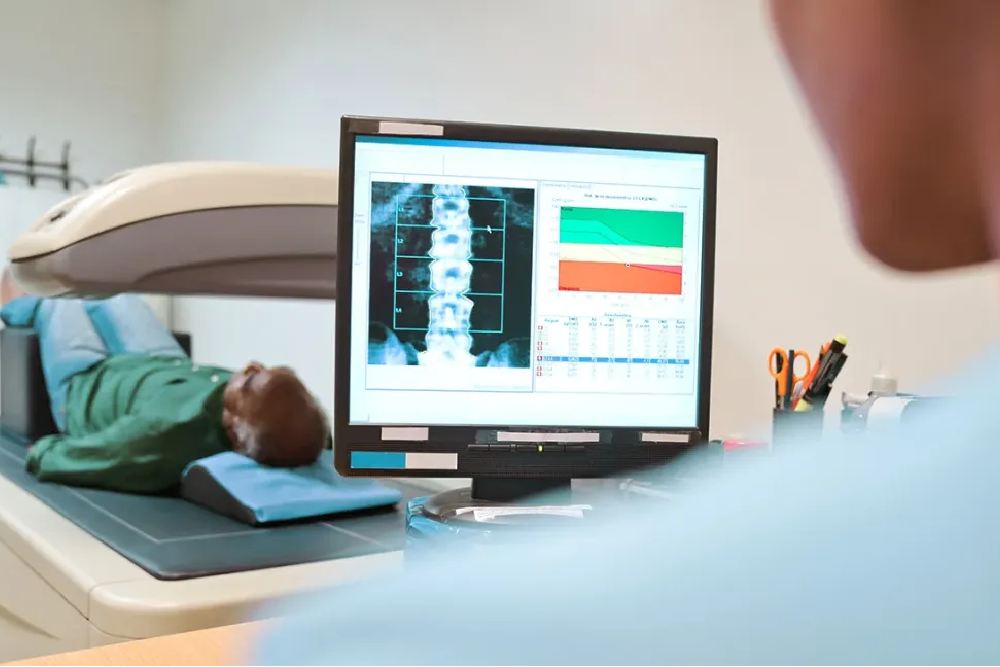
A DEXA body scan, as well as being an accurate and precise measure of your body composition, is also extremely comprehensive. Most people are simply blown away by the breadth and depth of data they’re presented with – information that can be used to immediately optimize training and nutrition plans.
Apart from the DEXA (X-ray) image of your body, which shows fat, lean mass and bone in contrasting colours, the DEXA report is completely data-driven. In other words it doesn’t contain any qualitative information at all – no descriptions, interpretations or comparisons for you to make immediate sense of what all the numbers actually mean.
An experienced DEXA practitioner will bring your results alive by explaining everything and putting your own results into perspective by comparing them against a huge set of population data. You should not skip the explanatory consultation for your first scan.
But if it’s been a long time since you had your first scan or you never received a detailed breakdown, here is a guide that will help you understand your report in more detail.
Table of Contents
The main body regions
The DEXA report will divide your body into the six main regions of left arm, right arm, left leg, right leg, trunk and head. In one or more of the report images, an angular grid of lines will show those divisions. Note that the lines that divide your legs from your trunk (torso) form a V-shape between your hips and your crotch. This means your pelvis is contained within the trunk, not the legs.
Body sub-regions
Most DEXA scans provide data for two important fat-bearing sub-regions known as the android (A) and gynoid (G) regions. If you know that these words derive from man and woman respectively, then it makes sense that your android region is around your belly and your gynoid region is around your hips, thighs and buttocks – respectively the areas where men and women typically hold the highest amounts of fat.
These sub-regions are used to determine your fat distribution (see later).
Fat mass
The total amount (kg) of body fat (adipose tissue) detected by DEXA. This includes subcutaneous fat as well as internal and visceral fat. Most people strive to have low levels of body fat.
Fat-free mass (FFM)
This is the total amount (kg) of everything that is not fat – in other words your lean body mass and bone. Fat-free mass may be shown as ‘Lean + BMC’ (where BMC is bone mass).
Lean mass
Lean mass is all fat-free soft tissue (so it does not include bone, like fat-free mass). The Lean mass is made up of muscle, organs, skin, ligaments, connective tissue, etc, but is usually read as if it were muscle mass. Water is included in lean mass too. Your report may show fat-free mass instead of lean mass or may show both.
Bone mass (BMC)
Bone mineral content is the collective mass of your entire skeleton. This is much lighter than you may expect, with most people’s BMC being between about 1000g (1kg) and 4000g (4kg).
Total mass
This is the fat, lean and bone added together and adds up to your total weight.
Body fat percentage (BF%)
This is the one metric that just about everyone wants to know and is the proportion of you that is body fat. It’s calculated by dividing your fat mass by your total mass. It’s important to realise (and many people are blinkered on this) that BF% is not a pure measure of fat because it’s affected by how much muscle (lean mass) you have.
Two people of the same height who have exactly the same amount of body fat will not have the same body fat percentage. The BF% of the one with more muscle (and who therefore weighs more) will be lower.
Regional data
Most or all the above metrics will be given for all the bodily regions, so you’ll be able to see variations between the left and right limbs for fat and lean mass, as well as see where you carry the highest proportion of fat – typically in the trunk and android (belly) for men, and legs and gynoid (hips/thighs) for women.
Do not get obsessed with left/right differences. No one is perfectly symmetric and it’s typical to see variations of 10% or more from one side to the other.
Fat distribution ratios
More important than small differences between your left and right sides, a number of metrics that compare body fat in your torso to that in your limbs reveal your fat distribution in regard to overall health, risk from disease and longevity.
The actual ratios can differ depending on the DEXA manufacturer but they include ratios that compare the fat in your android and gynoid regions (A/G ratio), and that in your upper body to your limbs (Trunk/Limb ratio and Fat Mass Ratio, FMR).
All these metrics will be small values (between about 0.5 and 2.0) and women will typically have lower values than men. Lower ratios are healthier than higher ones, as they mean your body fat is less concentrated in your upper body and belly areas (where it can lead to internal, visceral fat).
Visceral Adipose Tissue (VAT)
Your fat distribution needs to be read in conjunction with your total fat mass. If both are high than you are likely to have higher VAT (visceral fat). This is the ‘bad’ fat that surrounds your internal organs and is associated with serious diseases like type-2 diabetes, heart diseases and Alzheimer’s.
Thresholds for what is normal differ by DEXA make and model but it’s best to know that, whatever the indicated range, lower is better. Know also that visceral fat typically increases as we get older.
Fat Mass Index (FMI) and Lean Mass Index (LMI)
These are the best metrics for establishing your overall levels of body fat and muscle and for seeing how you rank compared to your peers (people of the same age, sex and ethnicity).
On your DEXA report, FMI and LMI may be shown as Fat Mass/Height^2 and Lean Mass/Height^2. In simple terms, they are, respectively, your body mass index for fat and muscle. Crucially (and what makes them the best metrics), they take into account your height and are each independent of the other. Not so with body fat percentage.
It’s difficult to generalise but in the pursuit of lower fat and higher muscle, men might aim to have an FMI below 5 and LMI above 19. For women, an FMI below 6 and an LMI above 15 would be good targets.
Conclusion
If you’re about to have your first DEXA body scan, don’t skimp on the explanatory consultation. It can prove very worthwhile. But if it’s too late for that, the information above will help you get more out of your DEXA report.